
Weave: Design System
STAFF PRODUCT DESIGNER, 2019–2026
Design Systems • Accessibility • AI-Assisted Prototyping
Weave Accreditation serves a lot of people at once: faculty and program leads writing a self-study, administrators keeping an eye on every program, and accreditors and peer reviewers rating the work. Most of them use it only a few times a year, so every screen has to make sense the moment they come back. When I joined, the only guidance was a ten-year-old style guide, so as Weave’s only product designer I created a new system from scratch on Angular Material, one component and pattern at a time, working closely with Weave’s engineering team in Crete.
Foundations
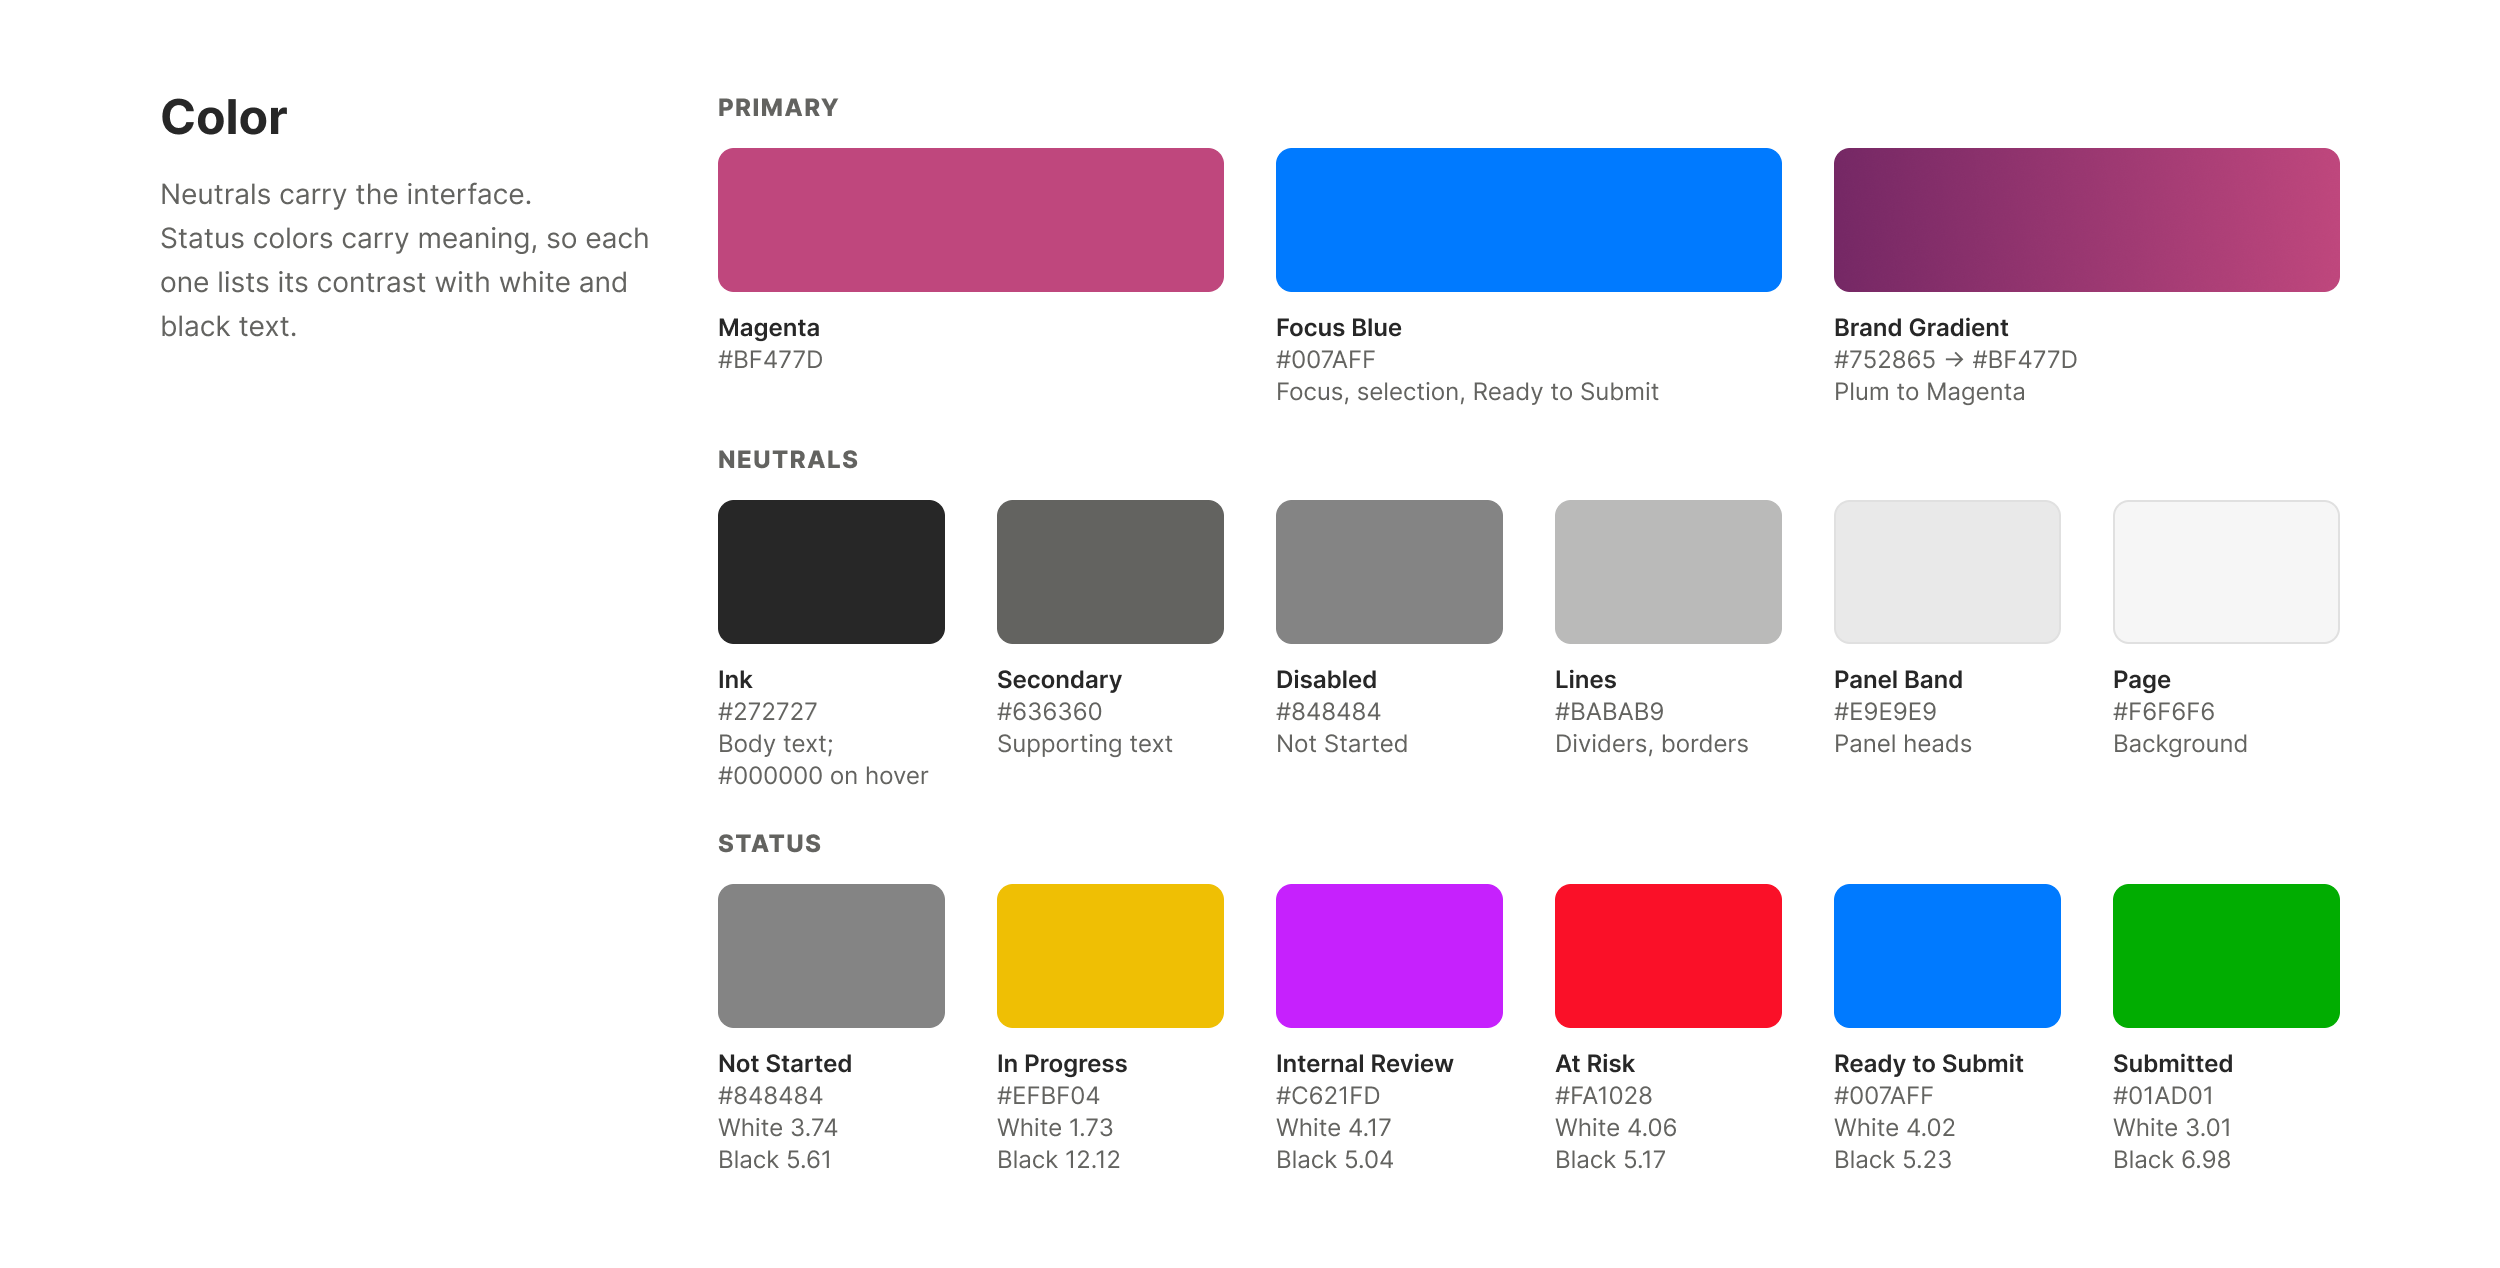
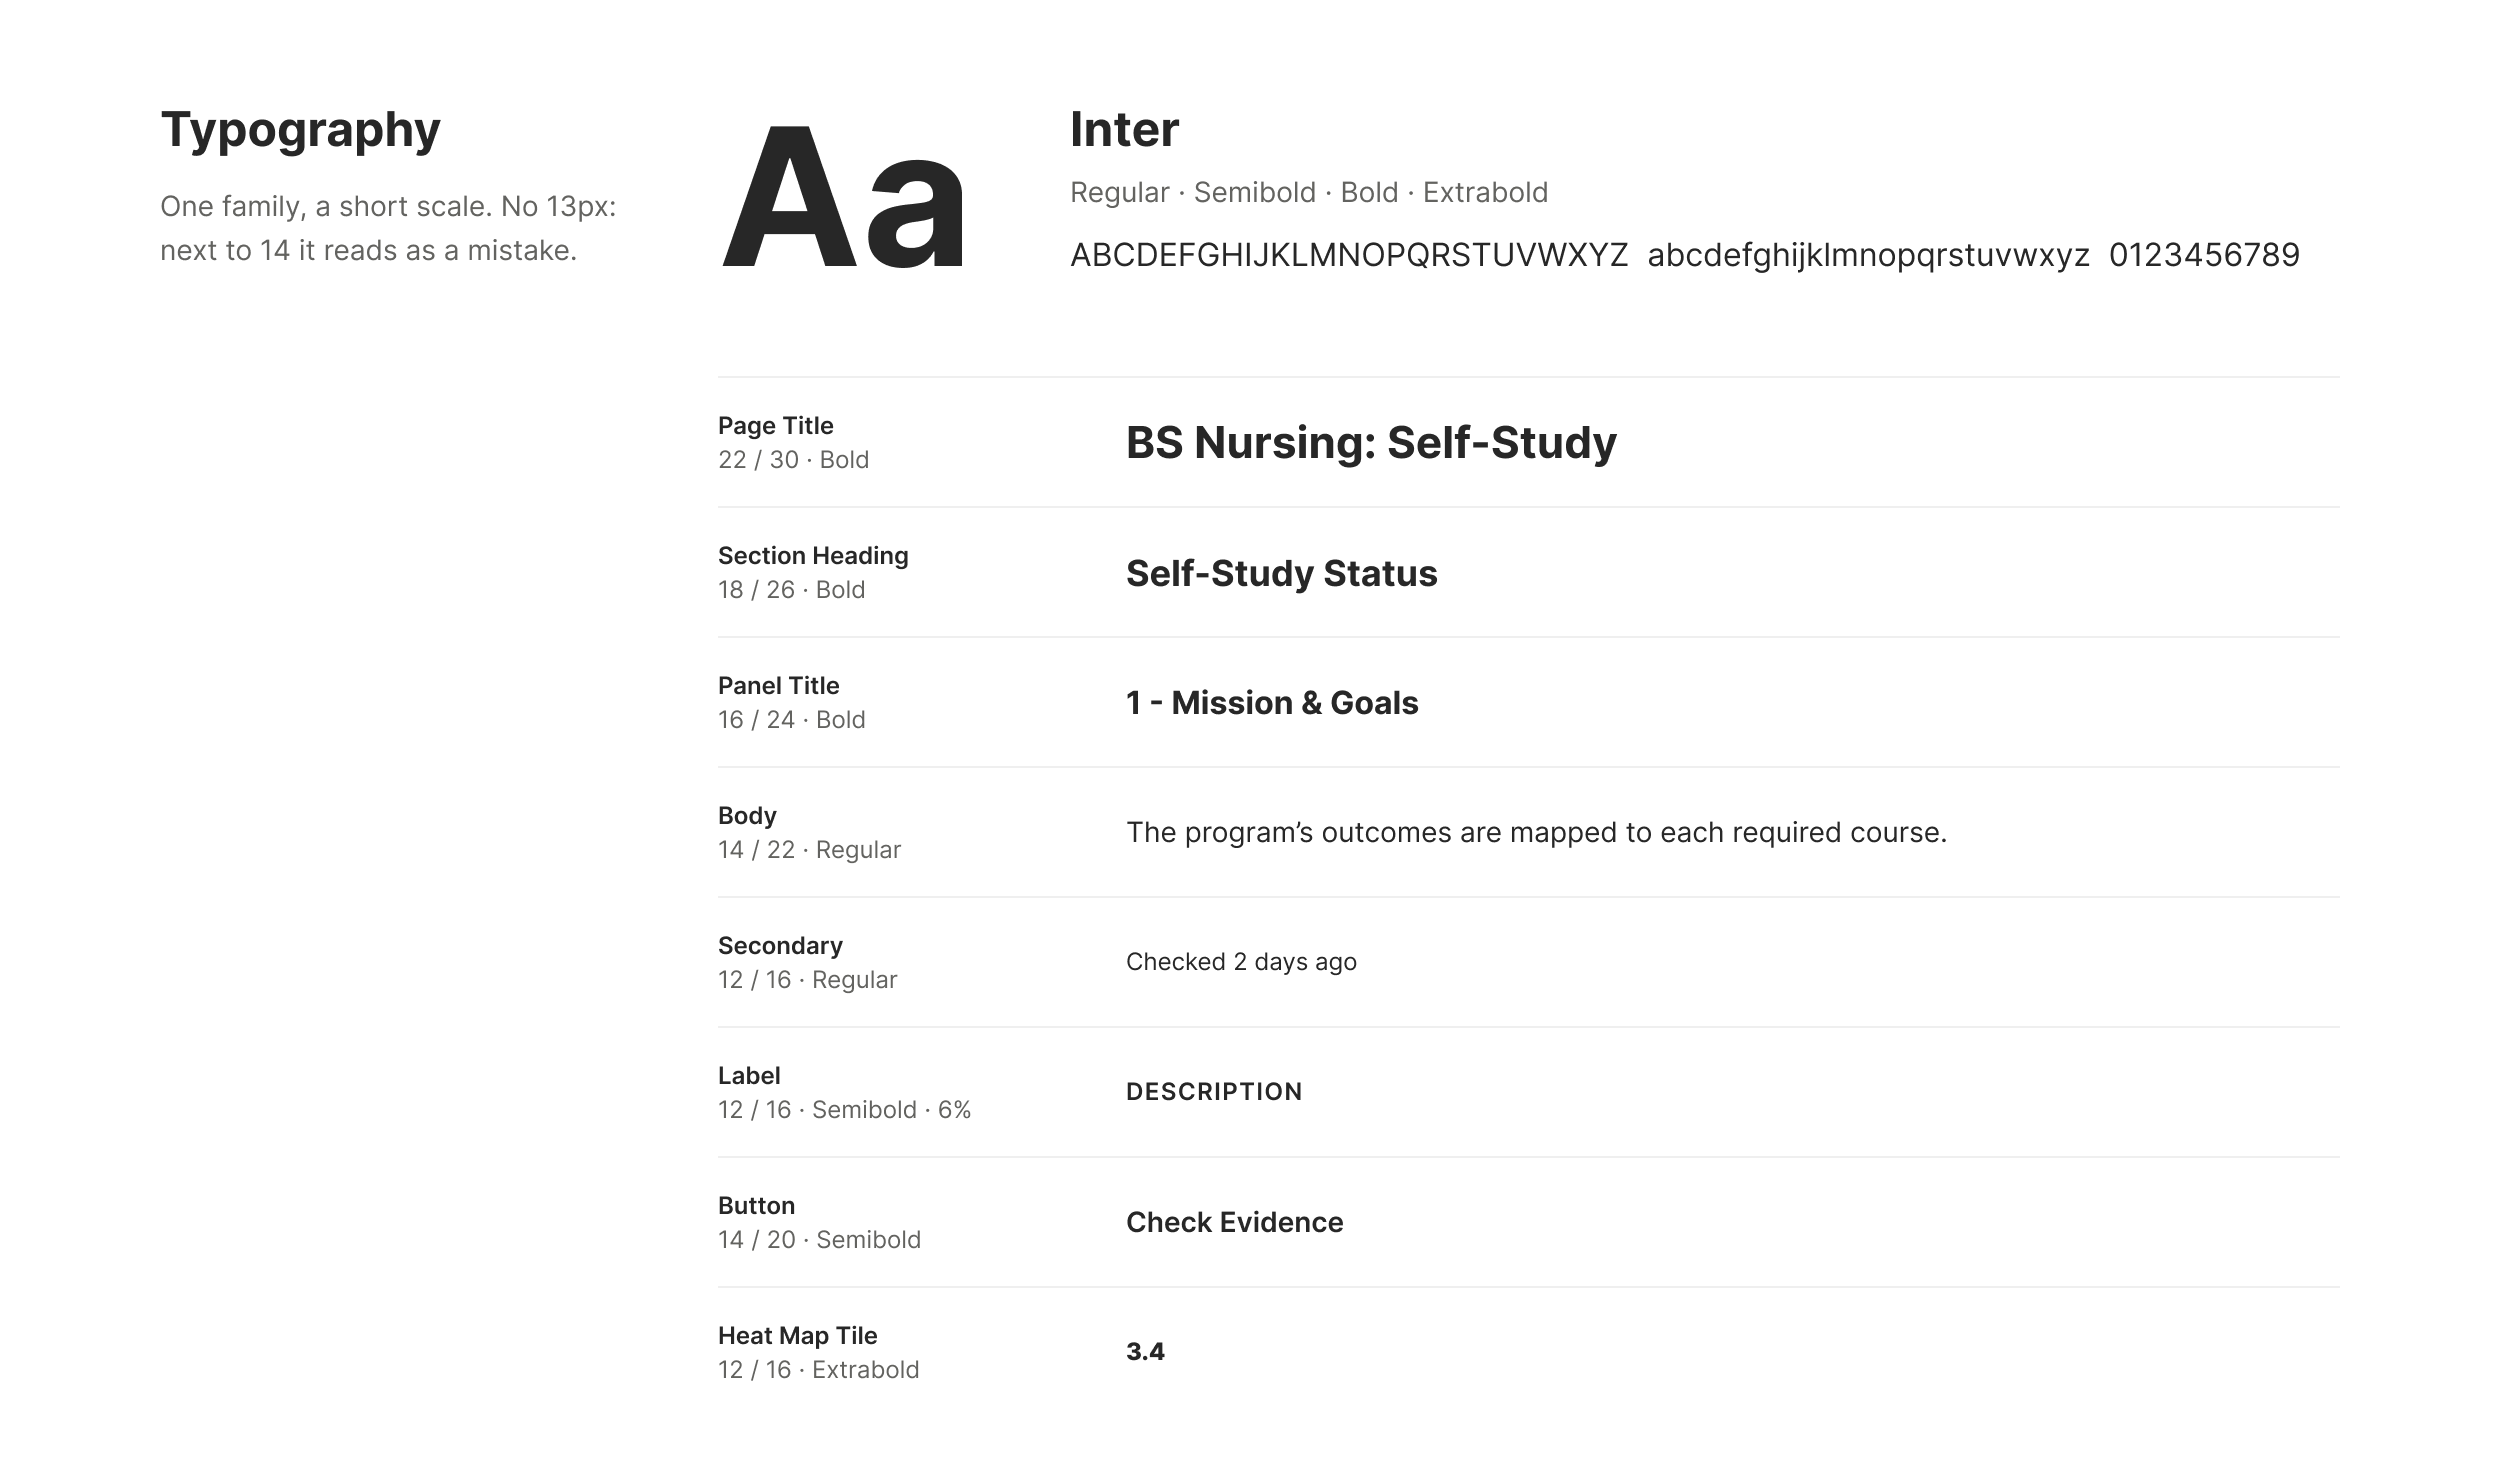
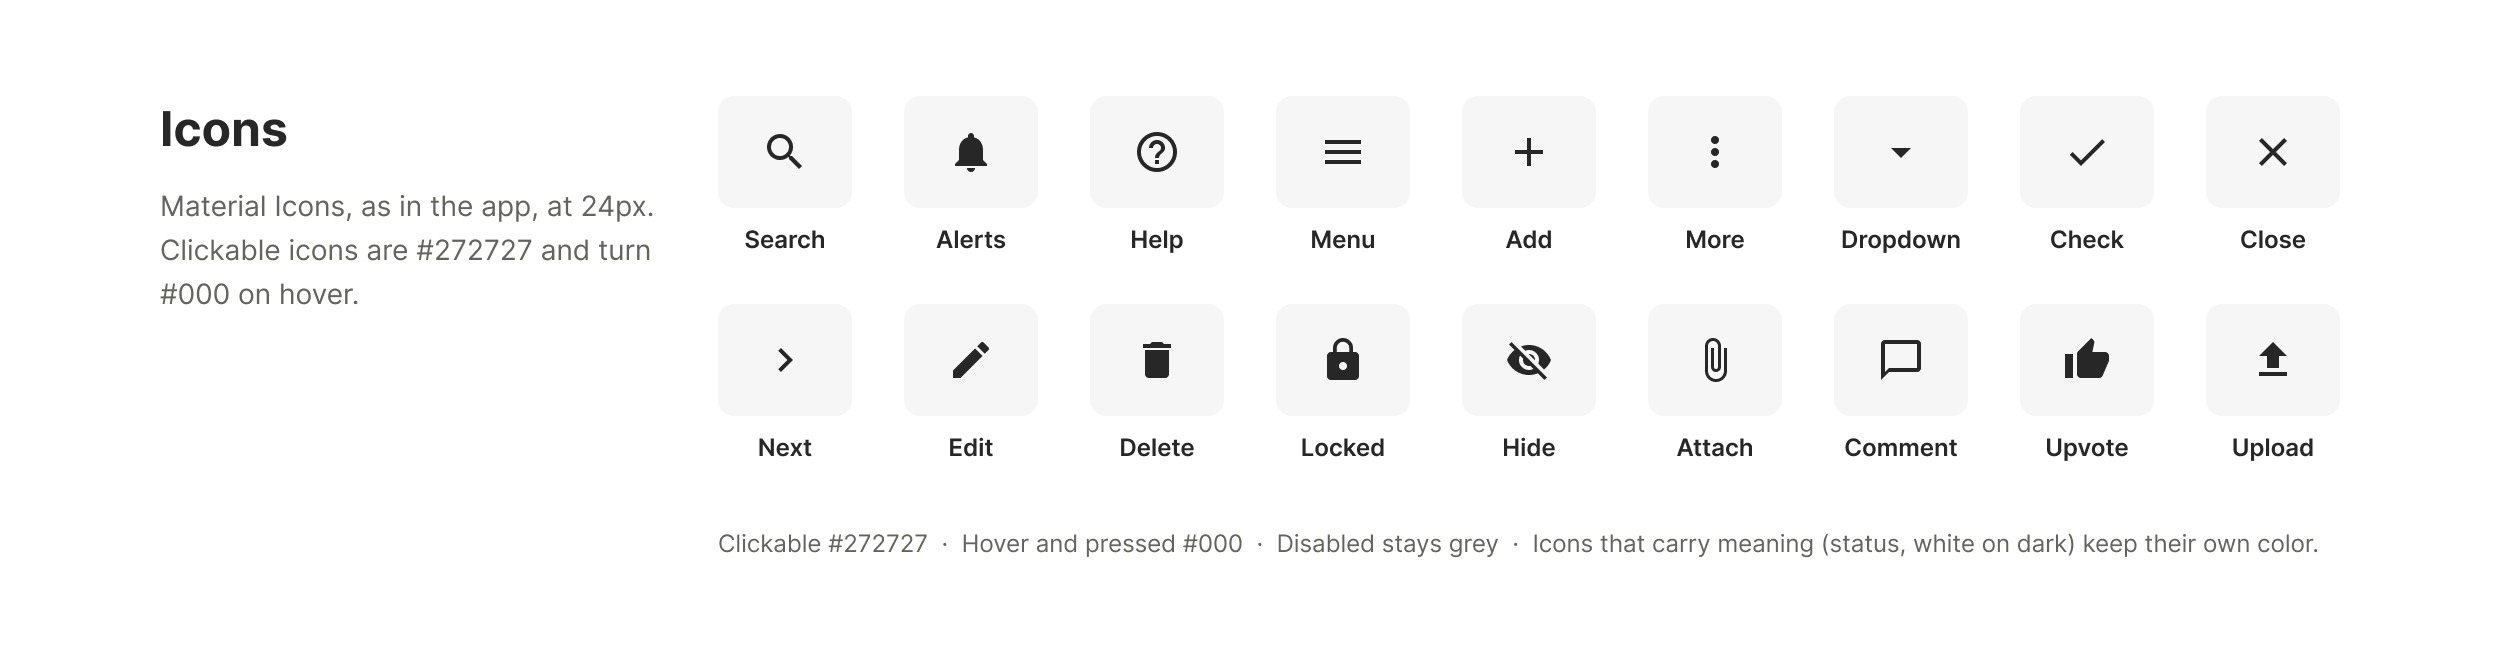
Neutrals carry the interface and color carries meaning. Six greys run from body text to page background, and every color is checked against WCAG contrast guidelines, which decides whether text on it is white or black. Type is one family, Inter, on a short scale with steps that stay clearly different. Icons come from Material, the same set the app uses.
One Pattern, Everywhere: Status and the Heat Map
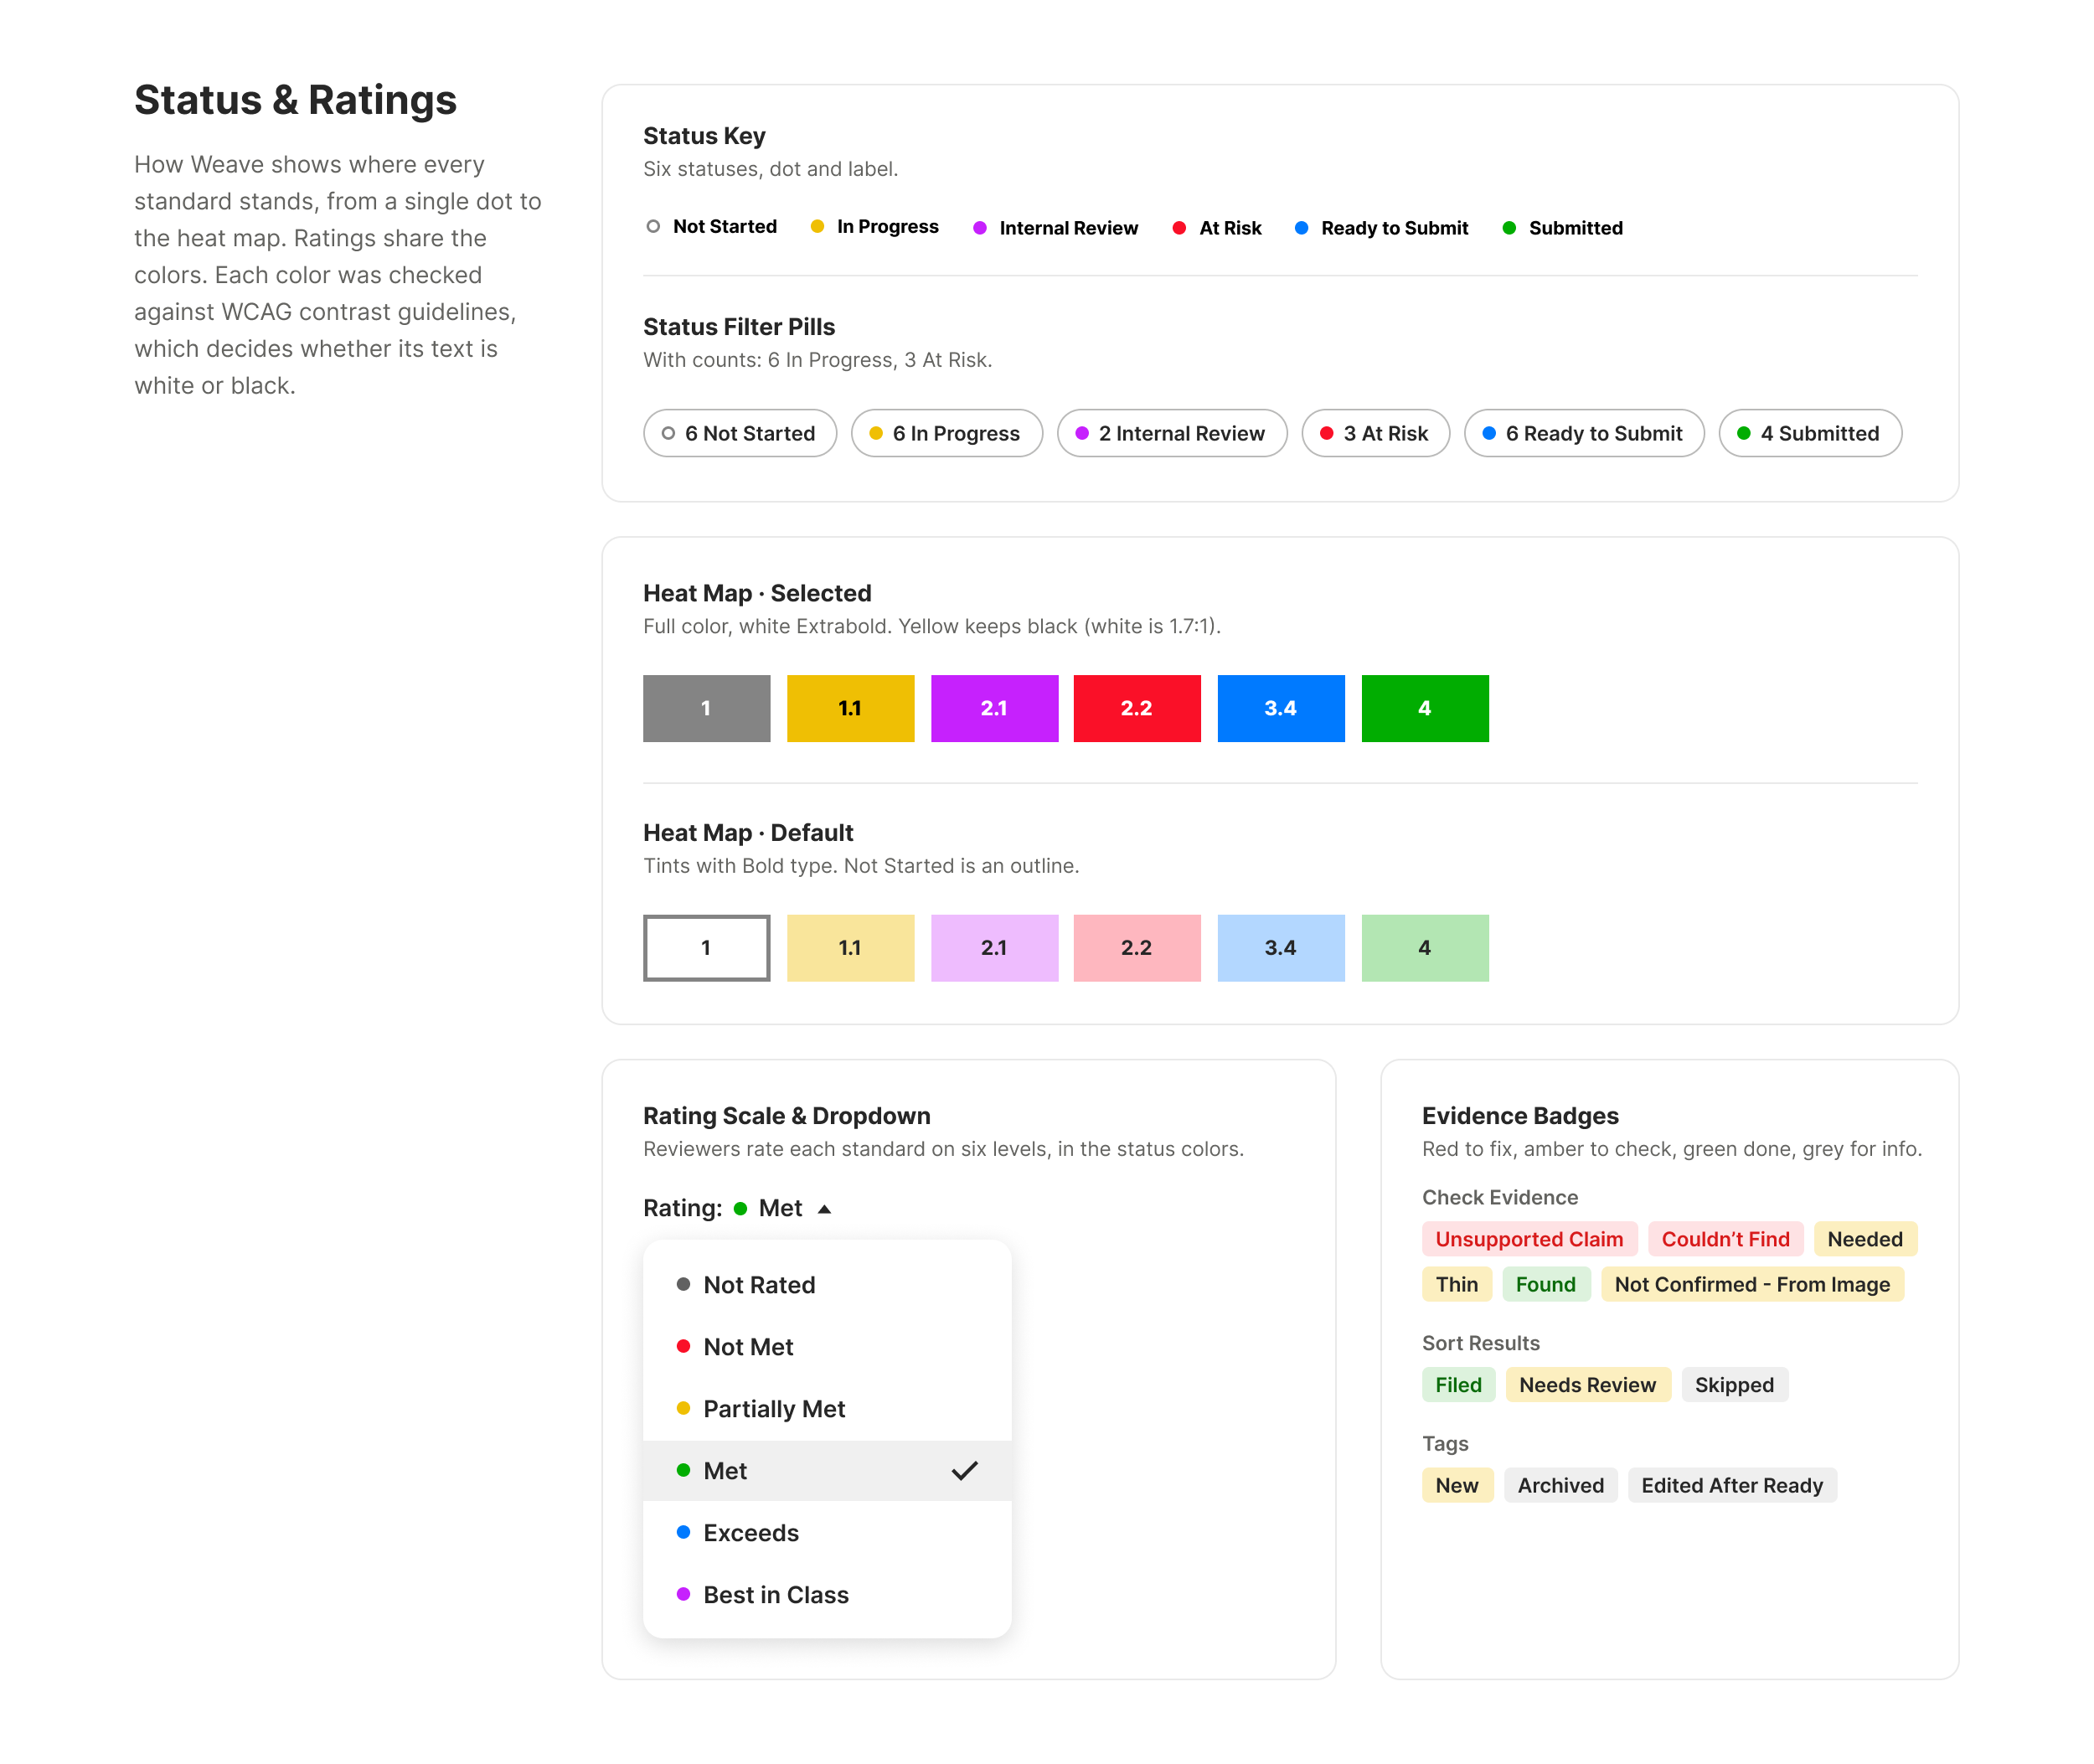
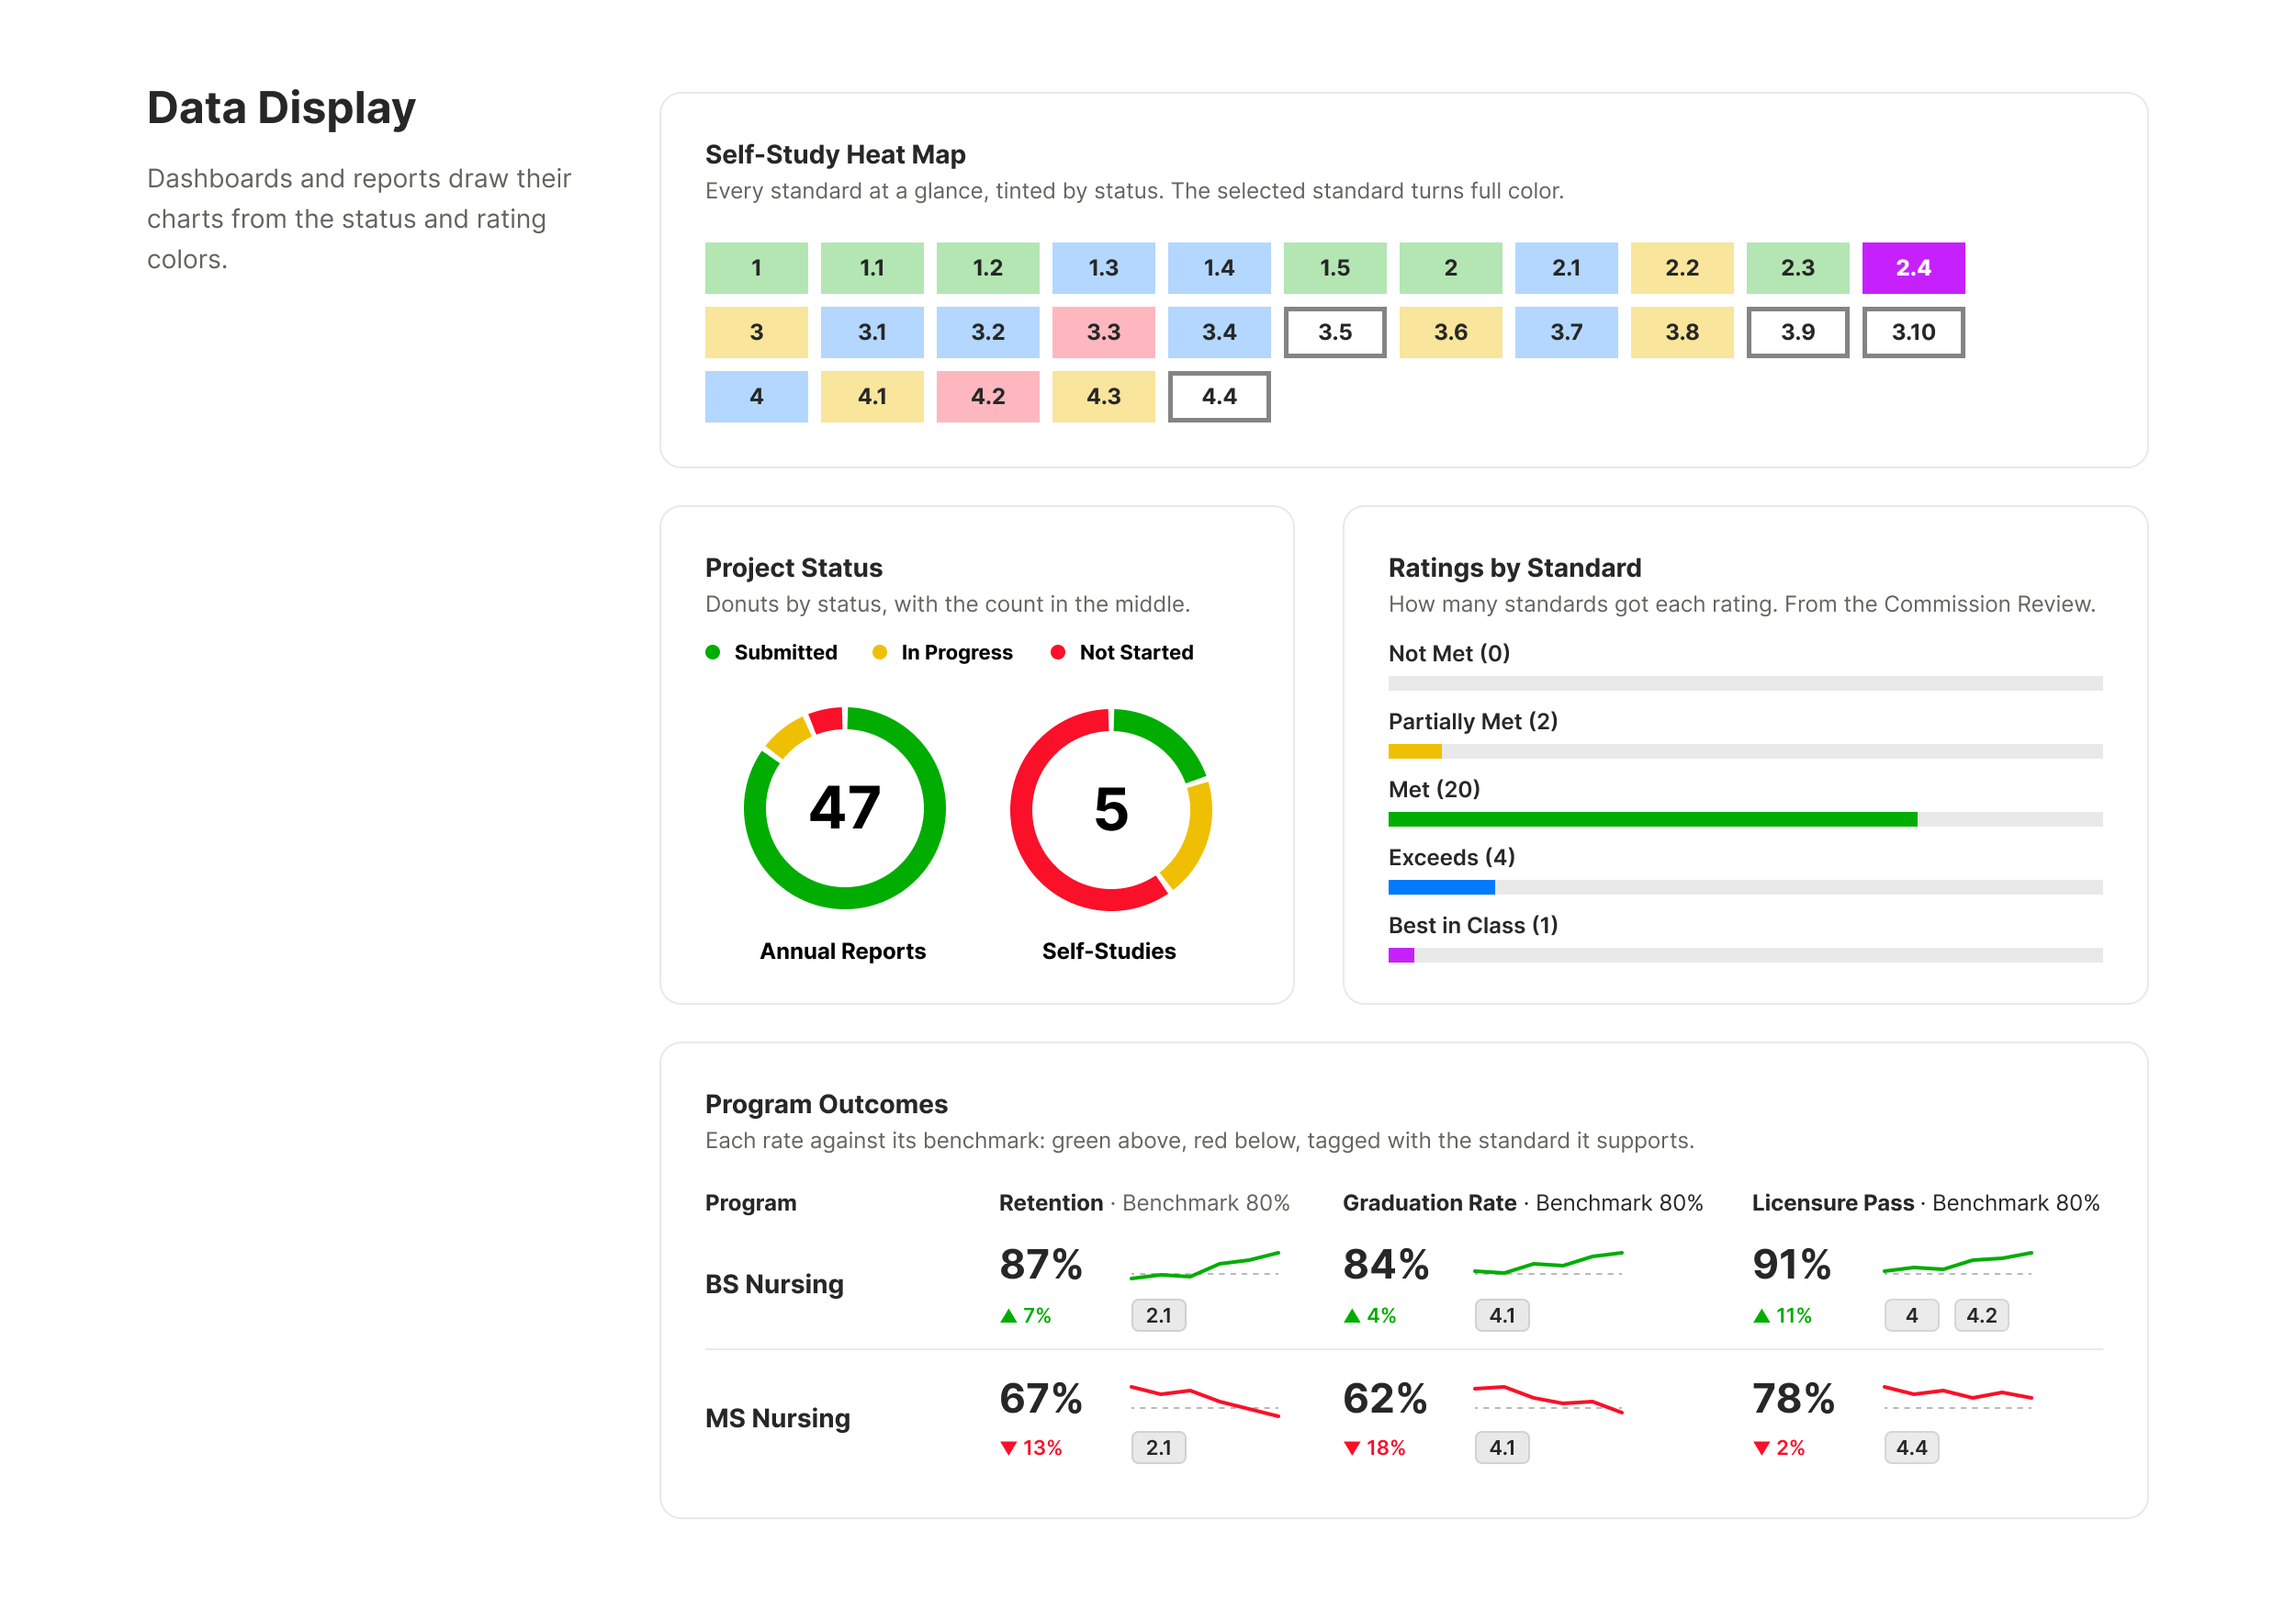
Every standard in a self-study has a status, and six colors show it, from a single dot to a full heat map. The heat map started as a simple grid in the self-study workspace: one tile per standard, so a program could see at a glance what was done and what needed help. People liked it, and soon reviewers and administrators wanted their own. The risk was that each version would drift and a colored tile would mean something different on every screen. So I kept it one pattern: the same tile and interaction everywhere, a key saying what the colors mean, and text that stays readable on every color. When reviewers rate a standard, the six ratings use the same colors, so nobody has to learn a second code.
Data Display
Dashboards and reports build their charts from the same colors: the heat map of every standard, ratings by standard in the decision letter, project status for an accreditor, and program outcomes measured against their benchmarks.
Components
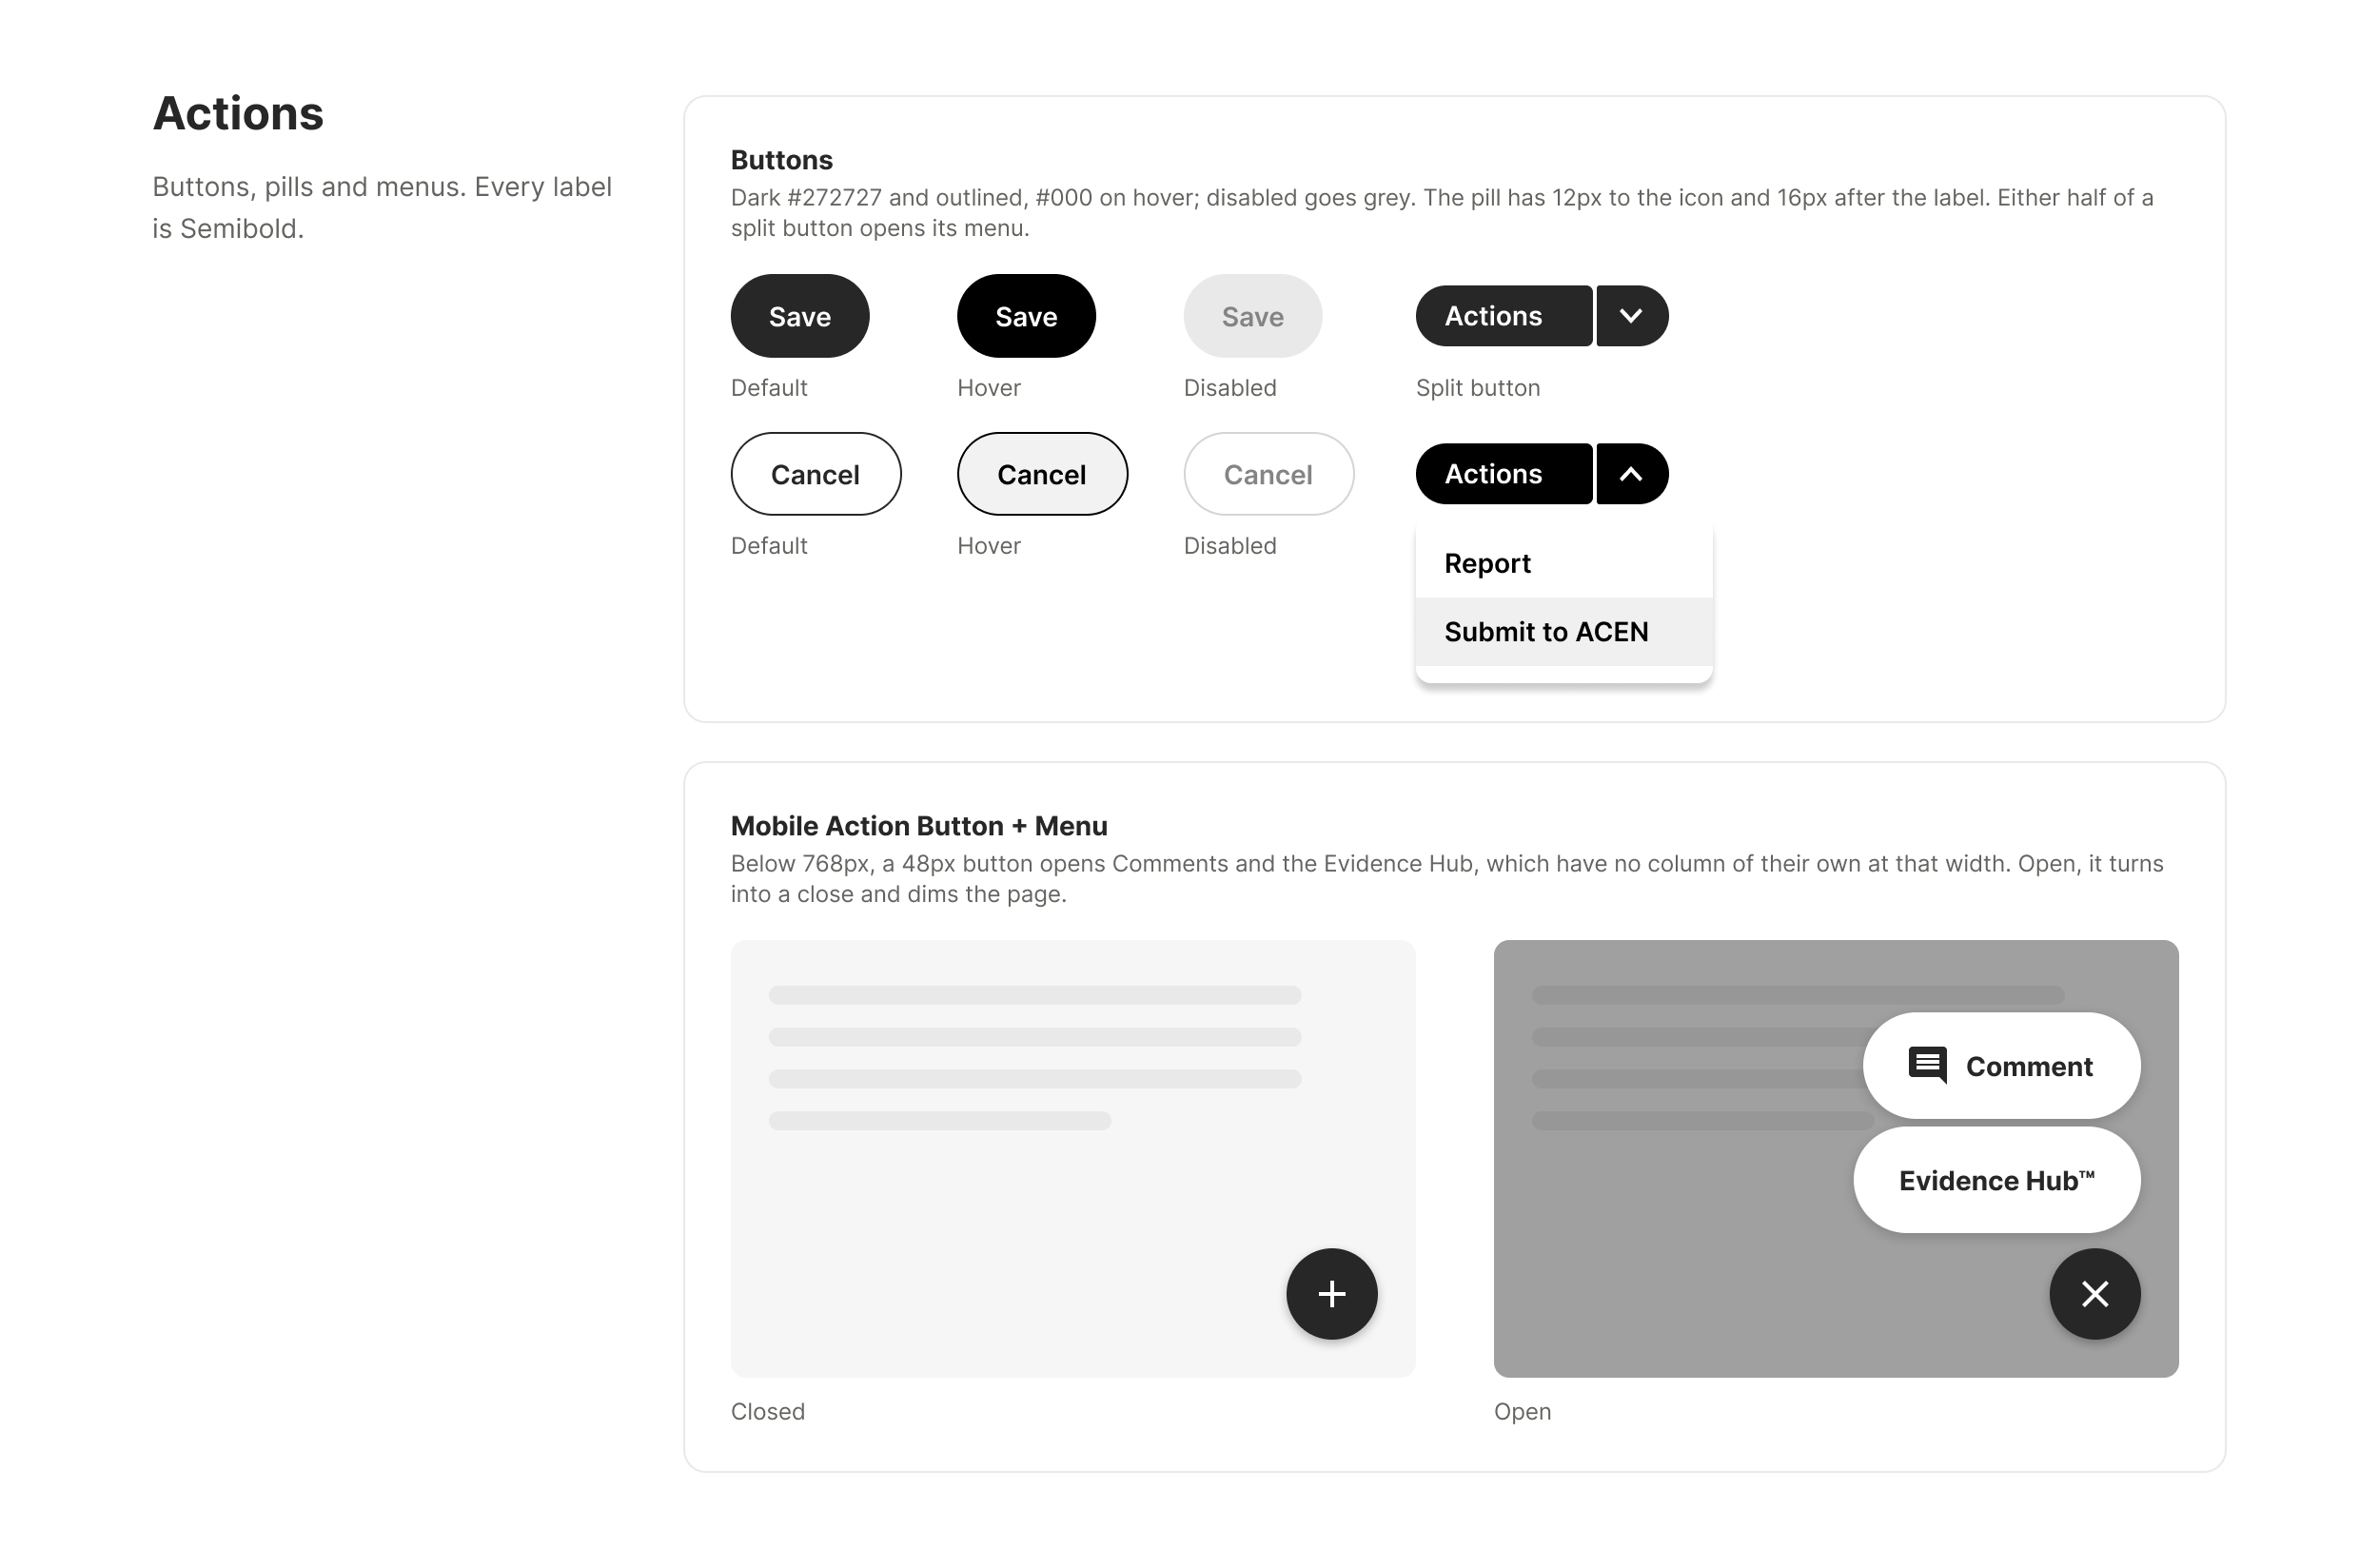
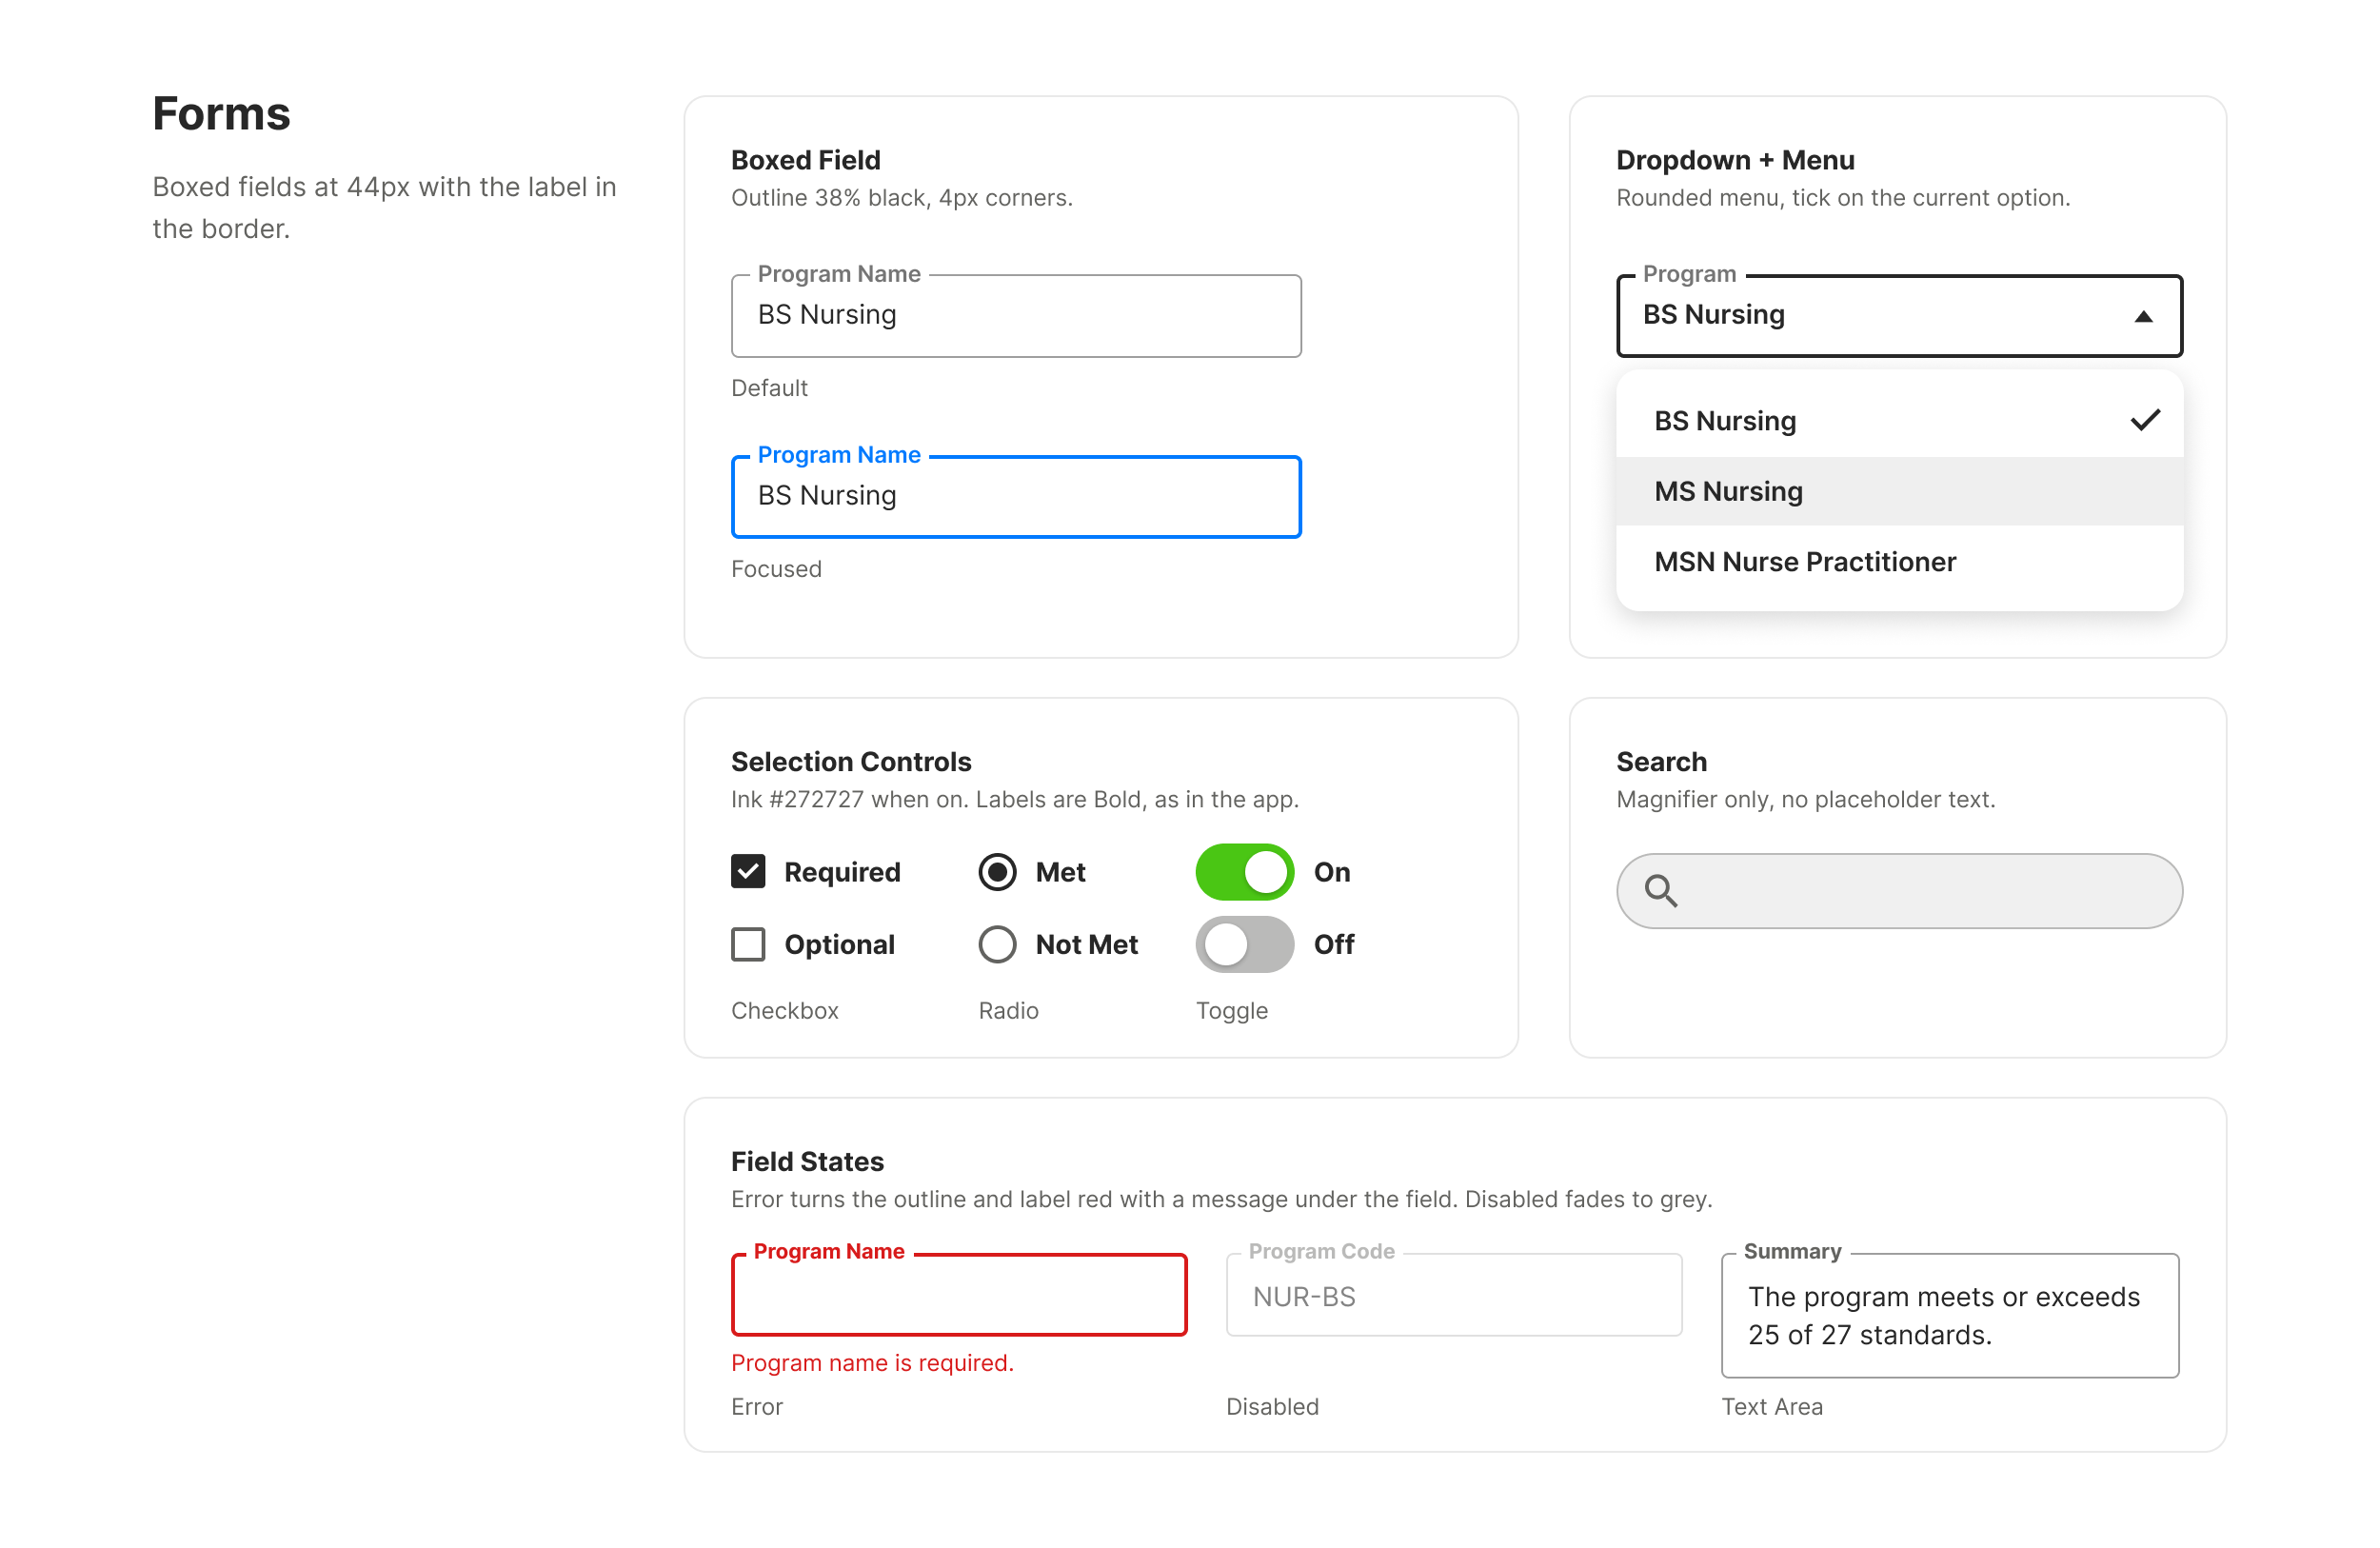
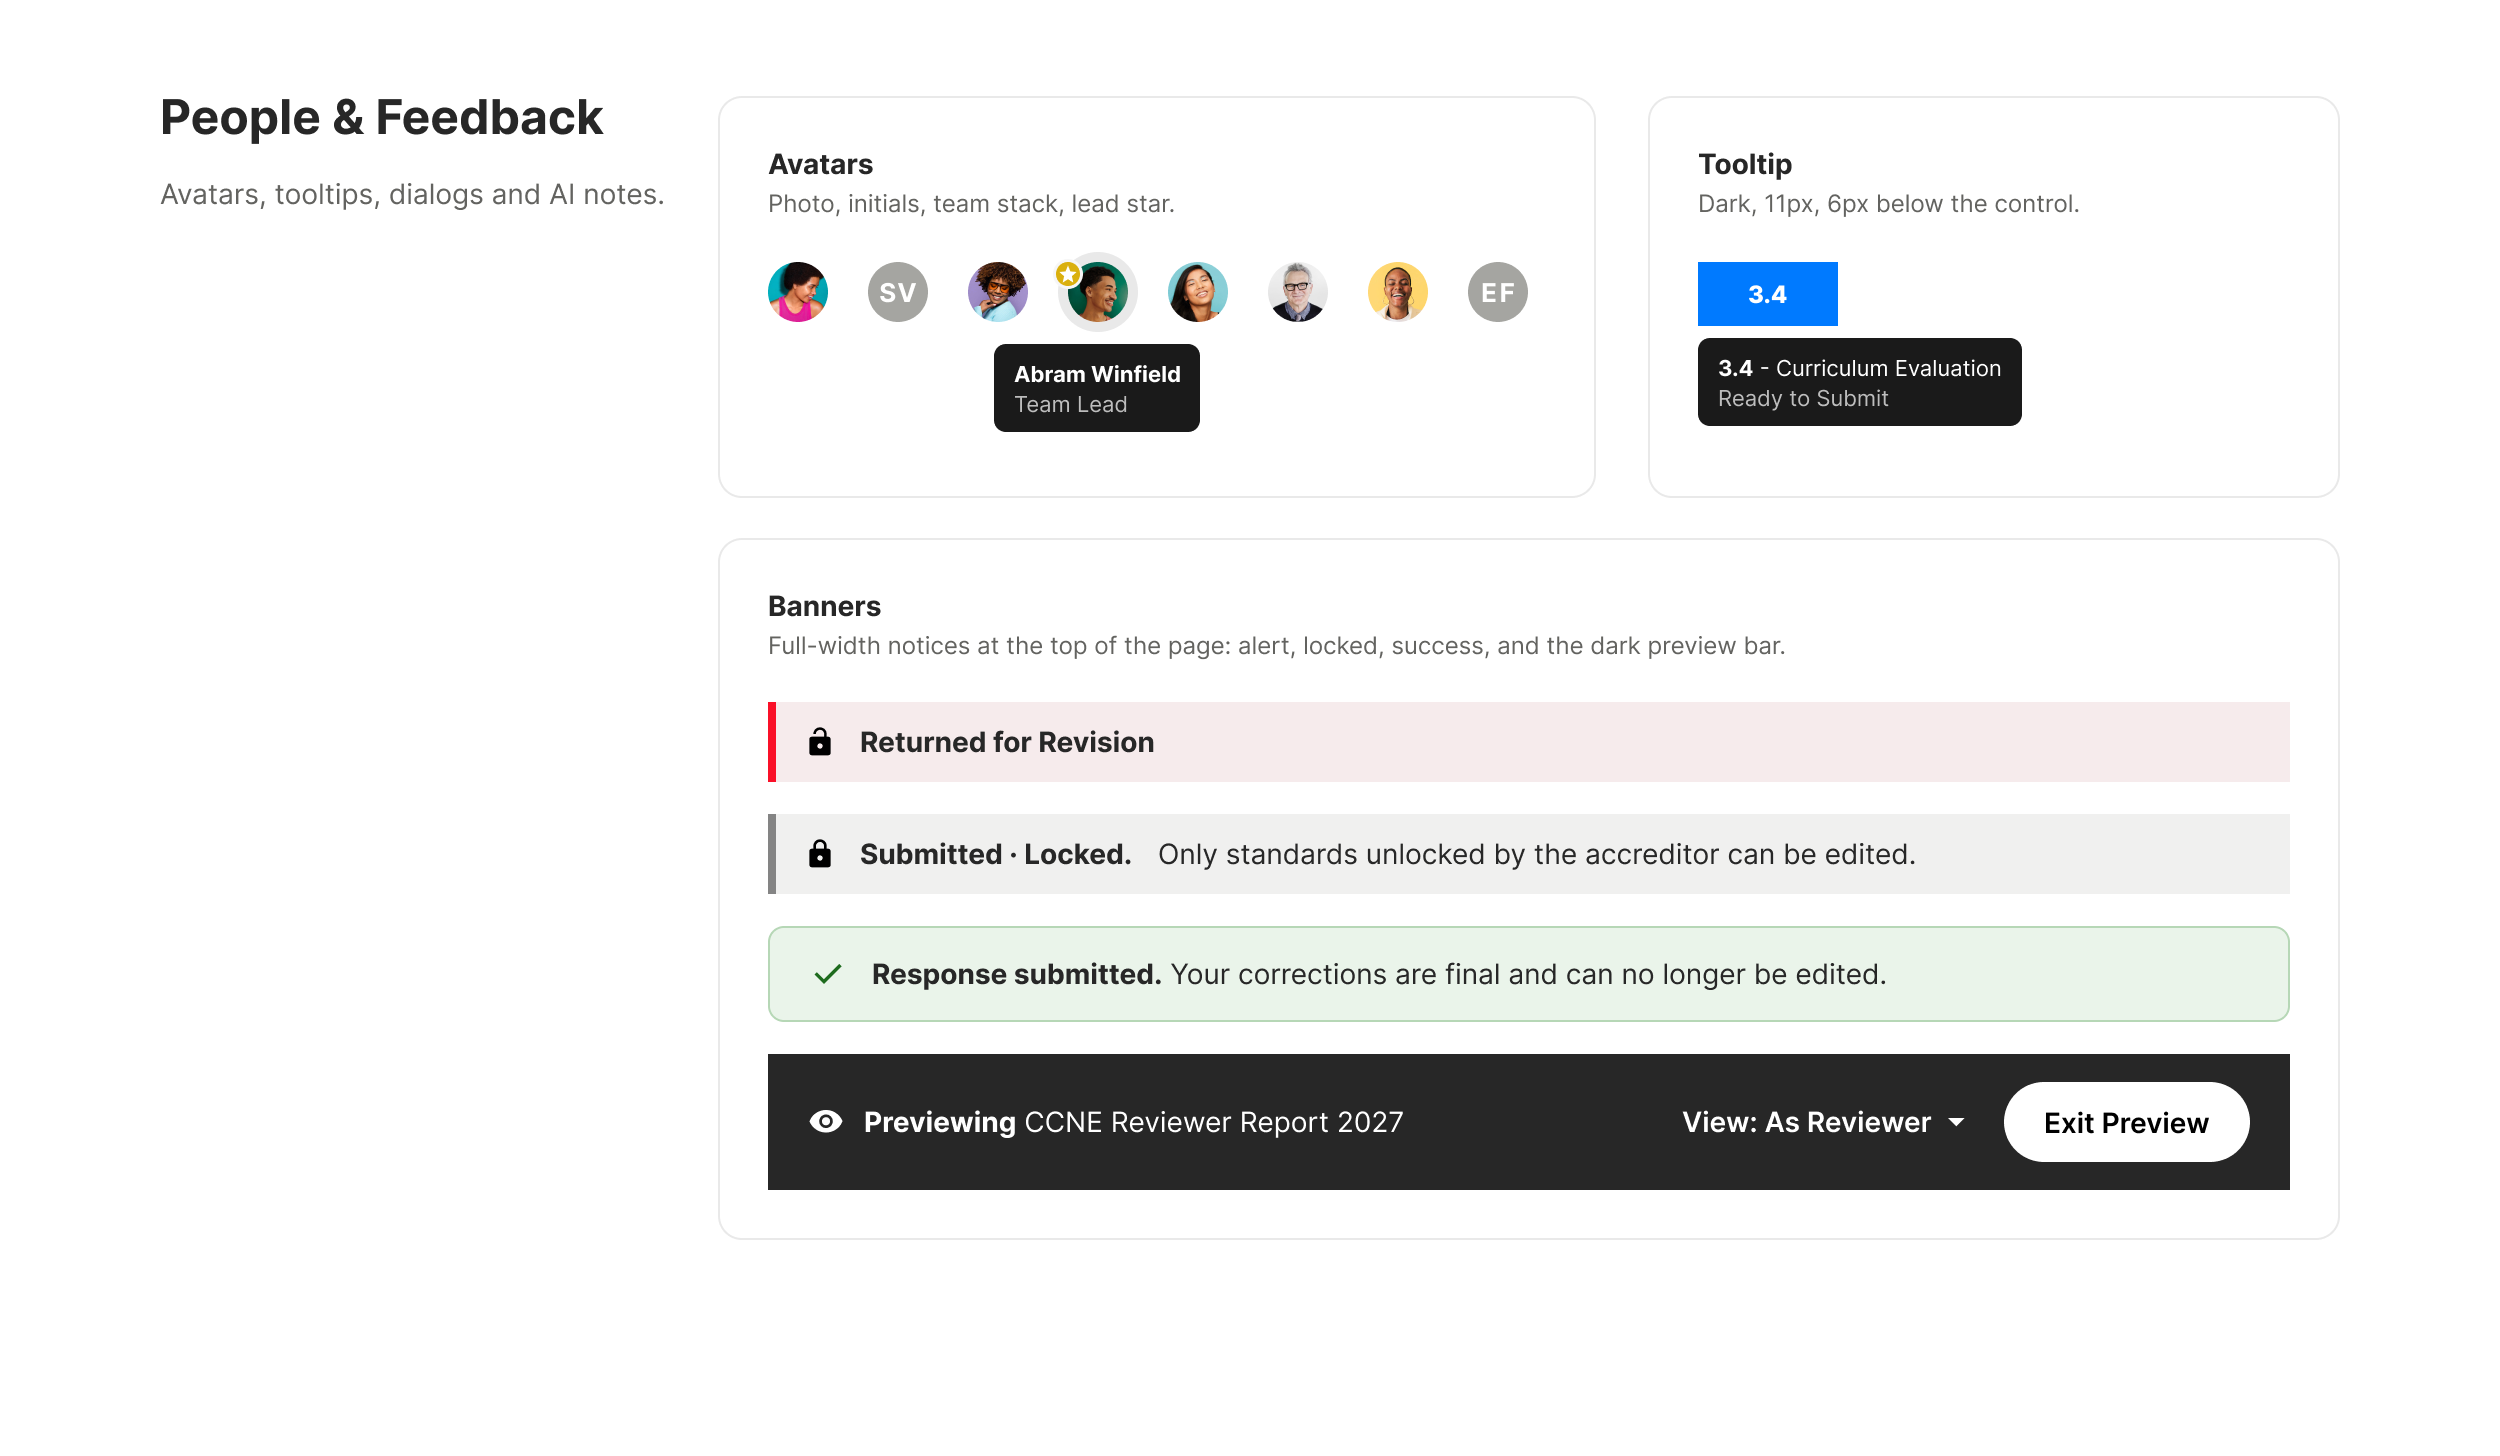
Buttons, menus, fields, avatars, tooltips and banners follow the same few rules on every screen: a single set of button styles, boxed fields with the label in the border, and labels on every icon-only button. On a phone, one button opens the tools that have no column of their own at that width.
Teaching the System to AI
I did most of my prototyping in code with Claude. To keep what it builds from drifting toward generic, I wrote the system down where the agent could read it: the live app’s real components and class names, the layout and accessibility rules, and the reasons behind them. Every prototype is built from the app’s own markup and styled by the production stylesheet, which a script pulls straight from the live app.
Then I check the output. A second script compares each page against the live app: how much of it uses real components, whether anything was invented, and whether any change to a live element is clearly marked as a proposal for engineering. I review every screen myself as well, and when the same mistake shows up twice, it becomes a new rule. One check caught white type on our yellow status color at about 1.7:1 contrast, far below the accessibility minimum. That became a rule for every heat map in the product.
What It Changed
Engineering built from working prototypes in the app’s own code instead of redlines. Design and development spoke a common language, which took out the slow translation layer of redlines and QA back-and-forth. New views started from existing components instead of from scratch, and one pattern carried across every role in the product, on desktop and on a phone.